- New Features & Enhancements
- Full Update Notes
Minitab Solution Center Features & Enhancements
The July 2025 release of the Minitab Solution Center includes enhancements, important bug fixes, and security updates.
Minitab Statistical Software Web App
Expanding Minitab AI Summaries for Graph Builder Graphs
User Benefit
For several graphs created from Graph Builder, you can now use Minitab AI to provide a natural language summary of the visualization to help you better understand patterns or trends as well as anomalies in your data.
Summary
Minitab AI summaries are now available for the following Graph Builder graphs: Histogram, Boxplot, Bar Chart, Pie Chart, and Pareto Chart. We will continue to expand the AI summaries for more graphs in subsequent releases.

Variability Chart Enhancements
User Benefit
For Variability Chart in Quality Tools, you can now enter one or more categorical By variables to create a separate Variability Chart for each category level for comparison. You also can request a log-10 transformation to the Y-scale of the Means chart when you graph the variability of response data across different factors that are highly skewed or affected by severe outliers.
Summary
Variability Chart now supports By variables and an option to apply a log-10 transformation on the Y-scale of the Means chart.
New Modules for Transportation and Retail Industries
User Benefit
Professionals in the transportation and retail industries now have access to add-on modules.
Summary
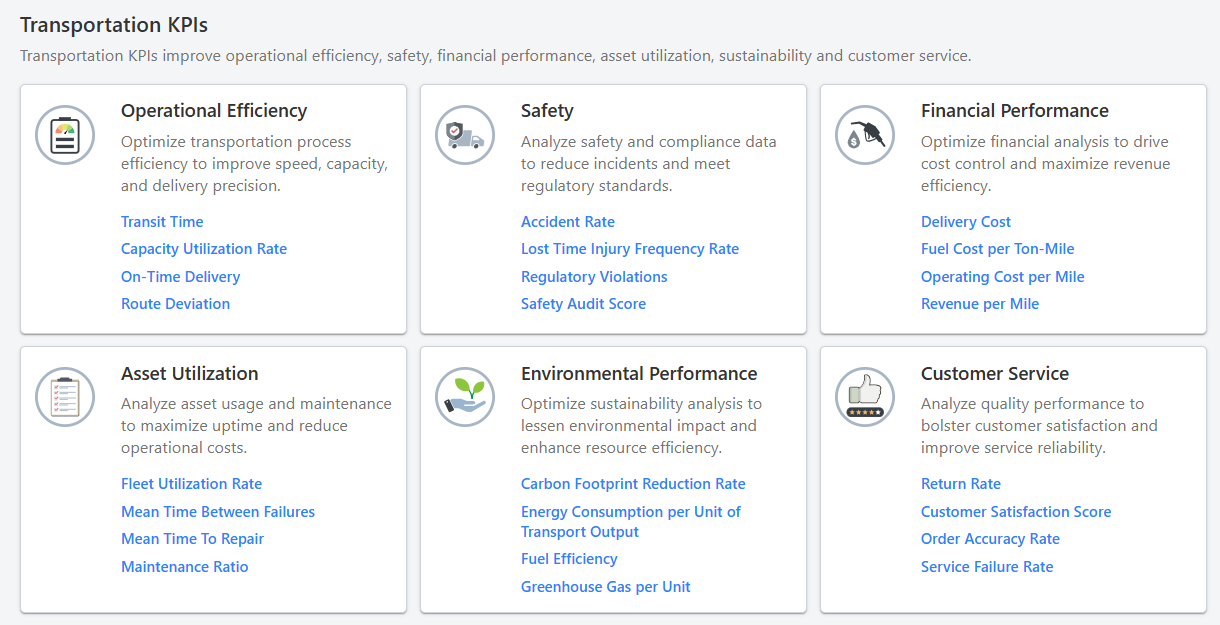
The Transportation Module helps transportation professionals quickly get started with data analysis to reduce transit time and analyze key performance indicators (KPIs) related to operational efficiency, asset utilization, safety, environmental performance, financial performance and customer service.
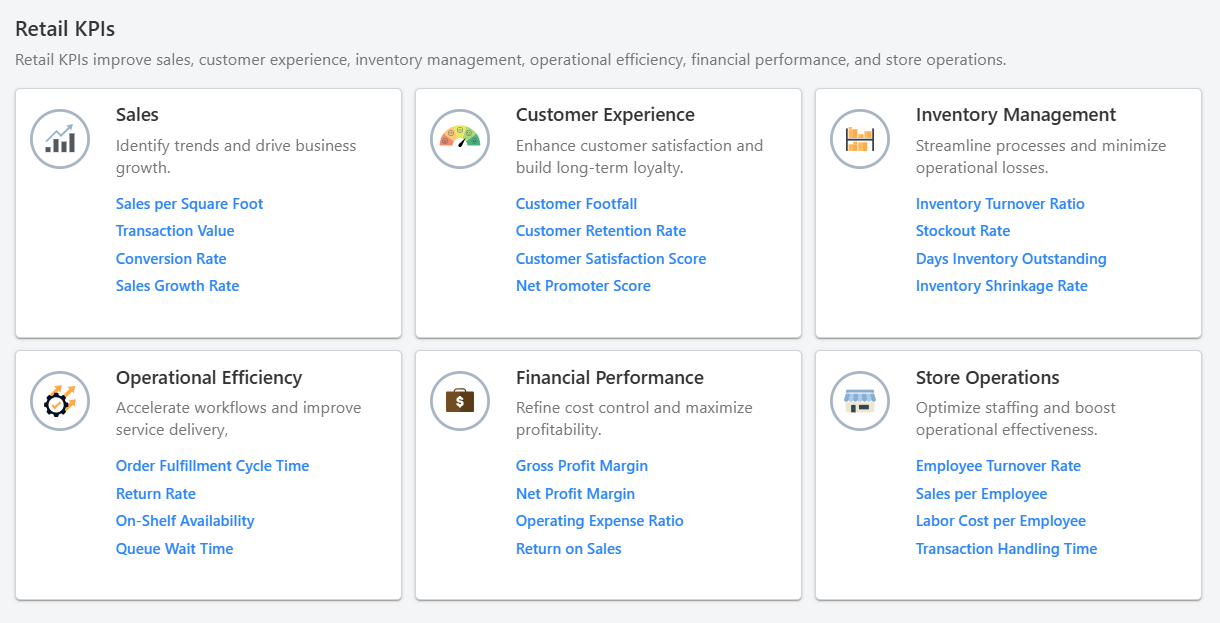
The Retail Module helps retail professionals quickly get started with data analysis, from increasing sales to analyzing key performance indicators (KPIs) related to customer experience, inventory management, operational efficiency, financial performance, store operations and sales.
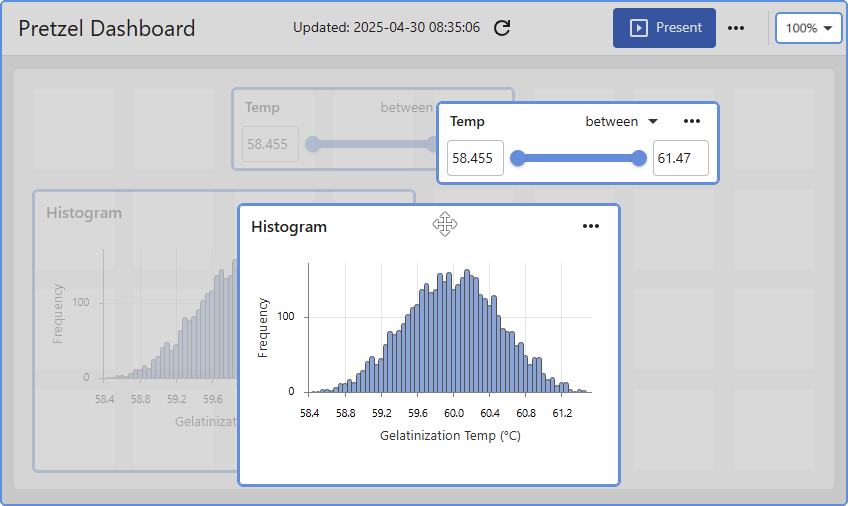
Minitab Dashboards
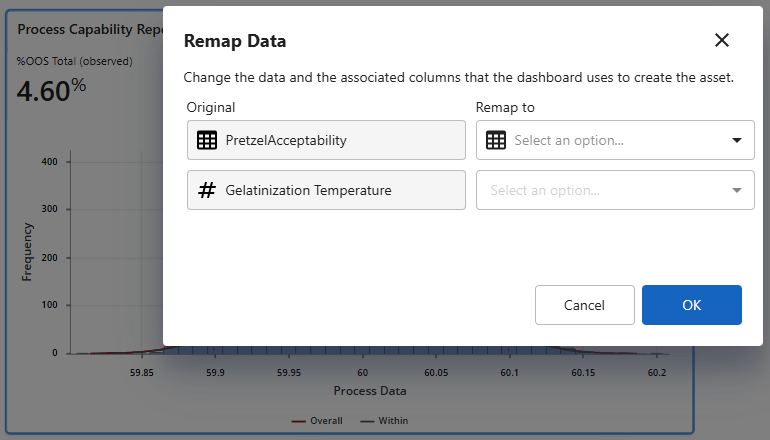
Copy and Remap Dashboard Assets
User Benefit
To facilitate the reuse and reapplication of established Dashboards to different data sources, we have added the ability to copy/paste dashboard assets and remap their source inputs.
Summary
In Minitab Dashboards, you can now copy and paste existing dashboard assets and remap to a different data source.
Minitab Workspace
Add linked files to your project
User Benefit
Users can now quickly access external files directly from their Workspace projects by adding linked files. Add links to a variety of files, including documents, presentations, spreadsheets, images, and any file created in the Minitab Solution Center.
Summary
Users can now add links to external files in their Workspace projects.
Minitab Data Center
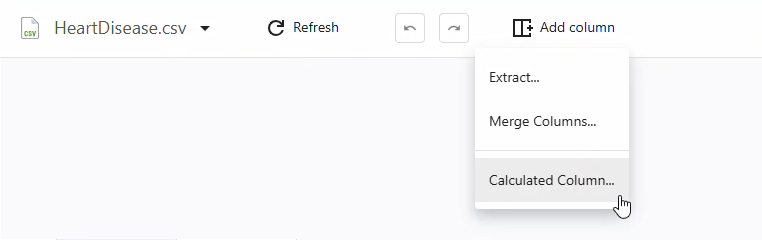
Calculated Column
User Benefit
Users may now implement a variety of calculation-based data preparation steps.
Users can now leverage common mathematical functions, leveraging similar syntax from Minitab Statistical Software’s Calculator, to produce new columns of data.
Summary
Create new columns of data based on custom equations using hundreds of predefined mathematical functions, including common arithmetic, date/time, text, and statistical functions.
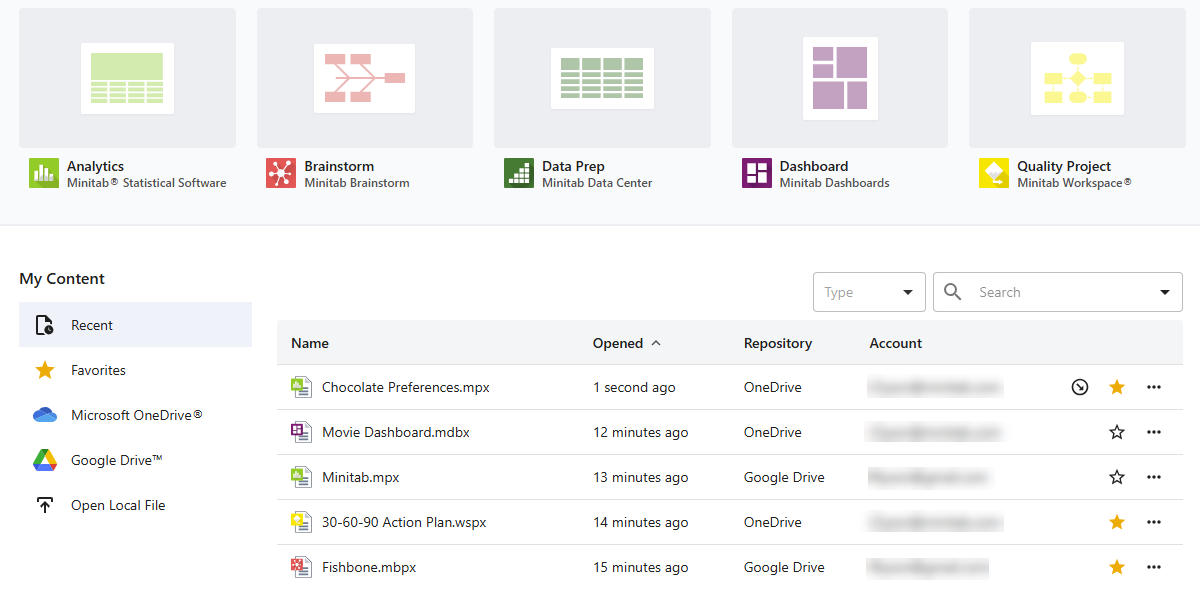
Online Repositories
Recent and Favorite Files
User Benefit
Users can now quickly access files that they recently opened or marked as favorites.
Summary
In the repository section of the landing page, access the files you need quickly and efficiently by viewing recently accessed files or by marking files as favorites. Both sections display recent and favorite files across your repositories (Microsoft OneDrive® and Google Drive™).
The May 2025 Release of the Minitab Solution Center includes enhancements, important bug fixes, and security updates.
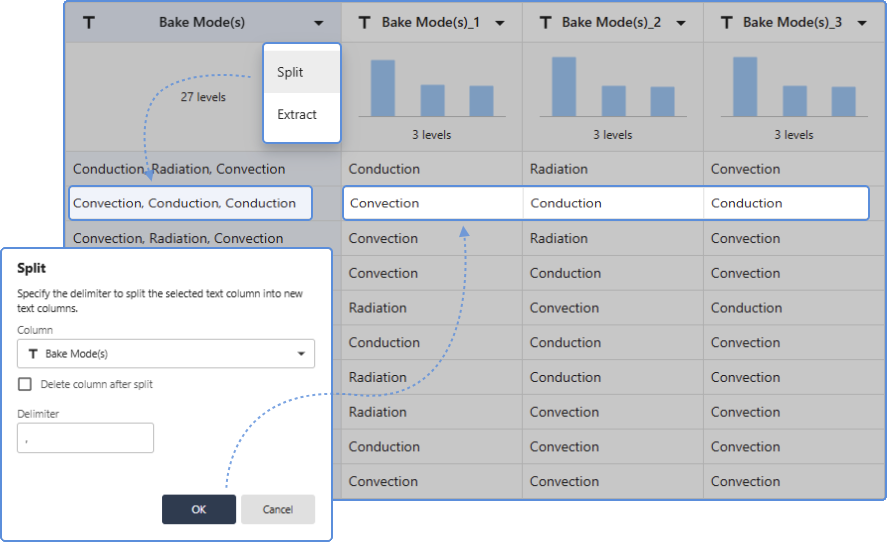
Minitab Data Center: Split and Extract
User Benefit
Use the new Split and Extract data cleanup operations to create new columns of data based on a subset of characters/strings from other Text Columns.
Summary
The Split and Extract data preparation steps allow you to subdivide the values within a text column, in order to pull out specific characters, strings, or list items. The Extract function provides more granular methods for parsing values that allows you to create one new column at a time, while the Split function caters to list values that can create up to 10 new columns at a time.
Minitab Dashboards: Enhanced Menus, Multiselect, and Zoom
User Benefit
When creating and editing a Dashboard, use the enhanced asset context menus as well as the multiselect capability to quickly build and organize the layout of your dashboard. And the new zoom feature allows you to more easily navigate across larger canvases.
Summary
Actions specific to sourcing and editing dashboard assets are now available in the enhanced context menu at the top-right corner of each asset. Multiple assets can be simultaneously selected for purposes of moving, deleting, and reorganizing the dashboard layout. And a native zoom control can be used to help navigate larger dashboards.
Minitab Solution Center Full Update Notes
Release Date: 16 July 2025
New Features in Minitab Solution Center
You can now quickly access files that were recently opened or marked as favorites. In the repository section of the landing page, access the files you need quickly and efficiently by viewing recently accessed files or by marking files as favorites. Both sections display recent and favorite files across your repositories (Microsoft OneDrive® and Google Drive™).
New Features in Minitab Web App
Variability Chart Enhancements
For Variability Chart in Quality Tools, you can now enter one or more categorical By variables to create a separate Variability Chart for each category level for comparison. You can also request a log-10 transformation to the Y-scale of the Means chart when you graph the variability of response data across different factors that are highly skewed or affected by severe outliers.
Transportation Add-on Module
The Transportation Module helps transportation professionals quickly get started with data analysis to do everything from reducing transit time to analyzing key performance indicators related to operational efficiency, asset utilization, safety, environmental performance, financial performance and customer service.
Retal Add-on Module
The Retail Module helps retail professionals quickly get started with data analysis to do everything from increasing sales to analyzing key performance indicators related to customer experience, inventory management, operational efficiency, financial performance, store operations and sales.
Problems Resolved in Minitab Web App
Subset Worksheet does not work as intended when the data set includes a large number of date/time values. (TT187158)
Unintended behavior occurs with certain date/time formats. (292654)
New Features in Minitab Data Center
Reorder Columns
Quickly organize the order of one or more data columns within the Data Grid. The reordering of columns allows you to arrange columns according to your needs and preferences.
Data Summary Panel Visualizations
The Data Summary Panel now provides larger interactive data visualizations that summarize each column of data. Using histograms, you can easily exclude numeric values that are greater than/less than target values or exclude date values that are before/after target dates. Using bar charts, you can directly filter or replace specific data values.
Calculated Column
Create new columns of data based on custom equations using hundreds of predefined mathematical functions.
New Features in Minitab Workspace Web App
Add linked files to your project
You can now quickly access external files directly from Workspace projects by adding linked files. Add links to a variety of files, including documents, presentations, spreadsheets, images, and any file created in the Minitab Solution Center.
Adjust column widths in forms tables
You can quickly and easily adjust column widths of tables on forms to make room for longer text values as needed.
New Features in Minitab Dashboards
Copy & Remap Assets
In Edit mode, you can copy and paste dashboard assets and remap existing assets to a different data source.
Release Date: 18 June 2025
New Feature in Minitab Data Center
Use the Quick Prep menu to prepare data more quickly. This menu provides convenient access to common filtering options for individual values based on column type.
Problem Resolved in Minitab Data Center
The following issue was resolved in Minitab Solution Center June 2025.
- The "Extract at Index" label extends to two separate lines in German. (287738)
Problem Resolved in Minitab Dashboards
The following issue was resolved in Minitab Solution Center June 2025.
- The related dashboard asset is cleared out and needs to be rebuilt when you rename a column in Data Center. (287698)
Release Date: 21 May 2025
New Features in Minitab Web App
Wafer Plot
Wafer plot is a new visualization tool added to Graph Builder that provides the ability to pinpoint the locations of defective integrated circuits or chips across the wafer. Wafer plot is a specialized heatmap used in semiconductor manufacturing to identify potential root causes of manufacturing issues and facilitates the application of statistical process control methods to monitor and improve manufacturing processes.
Boxplot Y-scale Log Transformation
The Graph Builder now includes the option to apply a log transformation to the Y-scale on a Boxplot so you can visualize the distribution of continuous data that is highly skewed or affected by severe outliers.
Quick Designs
Quick Designs is a simple, guided dialog in the DOE menu to help get you started in choosing a design that is right for your problem. It encompasses most used design settings for: Definitive Screening, Factorial, General Full Factorial, Response Surface, Mixtures, and Taguchi designs.
Command Line and History
The Command Line and History pane is now integrated into the Minitab Statistical Software web application. You can use this tool to quickly repeat an analysis on a new set of data or construct a macro to automate a series of analyses.
Problems Resolved in Minitab Web App
- Unintended behavior occurs in graphical summaries and small data. (187463)
- The deletion of report annotation does not work as expected. (187497)
- Incorrect error handling occurs in Attribute Agreement Analysis with numbers as column names. (187263)
- ANOVA model controls do not handle certain characters. (183904)
New Features in Minitab Data Center
Split a text column
You can split columns that contain values separated by a delimiter into new columns. For example, you can split a column where each cell contains three values separated by a comma into three new columns.
Extract text values from a column
You can extract a specific number of characters or use an index to create a new column or overwrite the current column.
Standardize column lengths
You can specify whether to standardize the number of rows across all columns or allow unequal column lengths for a data set.
Refresh data from source
When the original source data file has updates, you can pull in the latest changes to your file in the Data Center.
New Features in Minitab Workspace Web App
Two new templates
Two new templates are available with this release of Workspace in the Minitab Solution Center. Now, you can identify and catalog the sources of variation in a system with the P-Diagram and stay organized with the Checklist.
Improved printing
You can print entire maps and brainstorming tools by selecting Print on the application view bar or by right-clicking the tool in the Navigator and choosing Print. From your browser’s print view, you can print the tool or export it to PDF by using Print to PDF or
Save as PDF. You can also adjust print settings such as layout, scale, and quality.
New Features in Minitab Dashboards
Pan/Zoom
Instead of using browser zoom, you can adjust the zoom level of the canvas area with a native zoom control. You can also pan vertically and horizontally without relying on the canvas scrollbars.
Allow interactions and paging in Edit Mode
You can fully interact with graph elements in both Present and Edit mode. You can view graph tooltips, zoom and pan on graph data regions, use the graph scale navigator/slider for time series and control charts, interact with graph legend items, and more.
In addition to using the Navigator to switch pages in Edit mode, you can also select different pages of the dashboard using the same page control displayed in Present mode.
Multi-select assets and slicers
In Edit mode, you can multi-select assets and slicers to drag, move, or delete them.
Simplified edit behavior
The Asset menu has improved functionality. In Edit mode, you can right-click to access the Asset menu.
Slicer interactivity
You can interact with slicers in Edit mode. The changes apply to all active assets.
Problems Resolved in Online Repositories
- You are not notified when Autosave fails due to lack of space in Cloud Storage Account (Microsoft OneDrive® and Google Drive™).
- Only the first 200 files are displayed in OneDrive.
- When you share a Minitab proprietary file through email, OneDrive unsuccessfully attempts to show the user a preview of the file and selecting the Open button does not successfully open the file.